Live Map
Visualise reports and activity across your sites in real time.
Live Map is the operational view of what is happening right now. It displays reports on an interactive map with area overlays and quick access to report details.
What you see
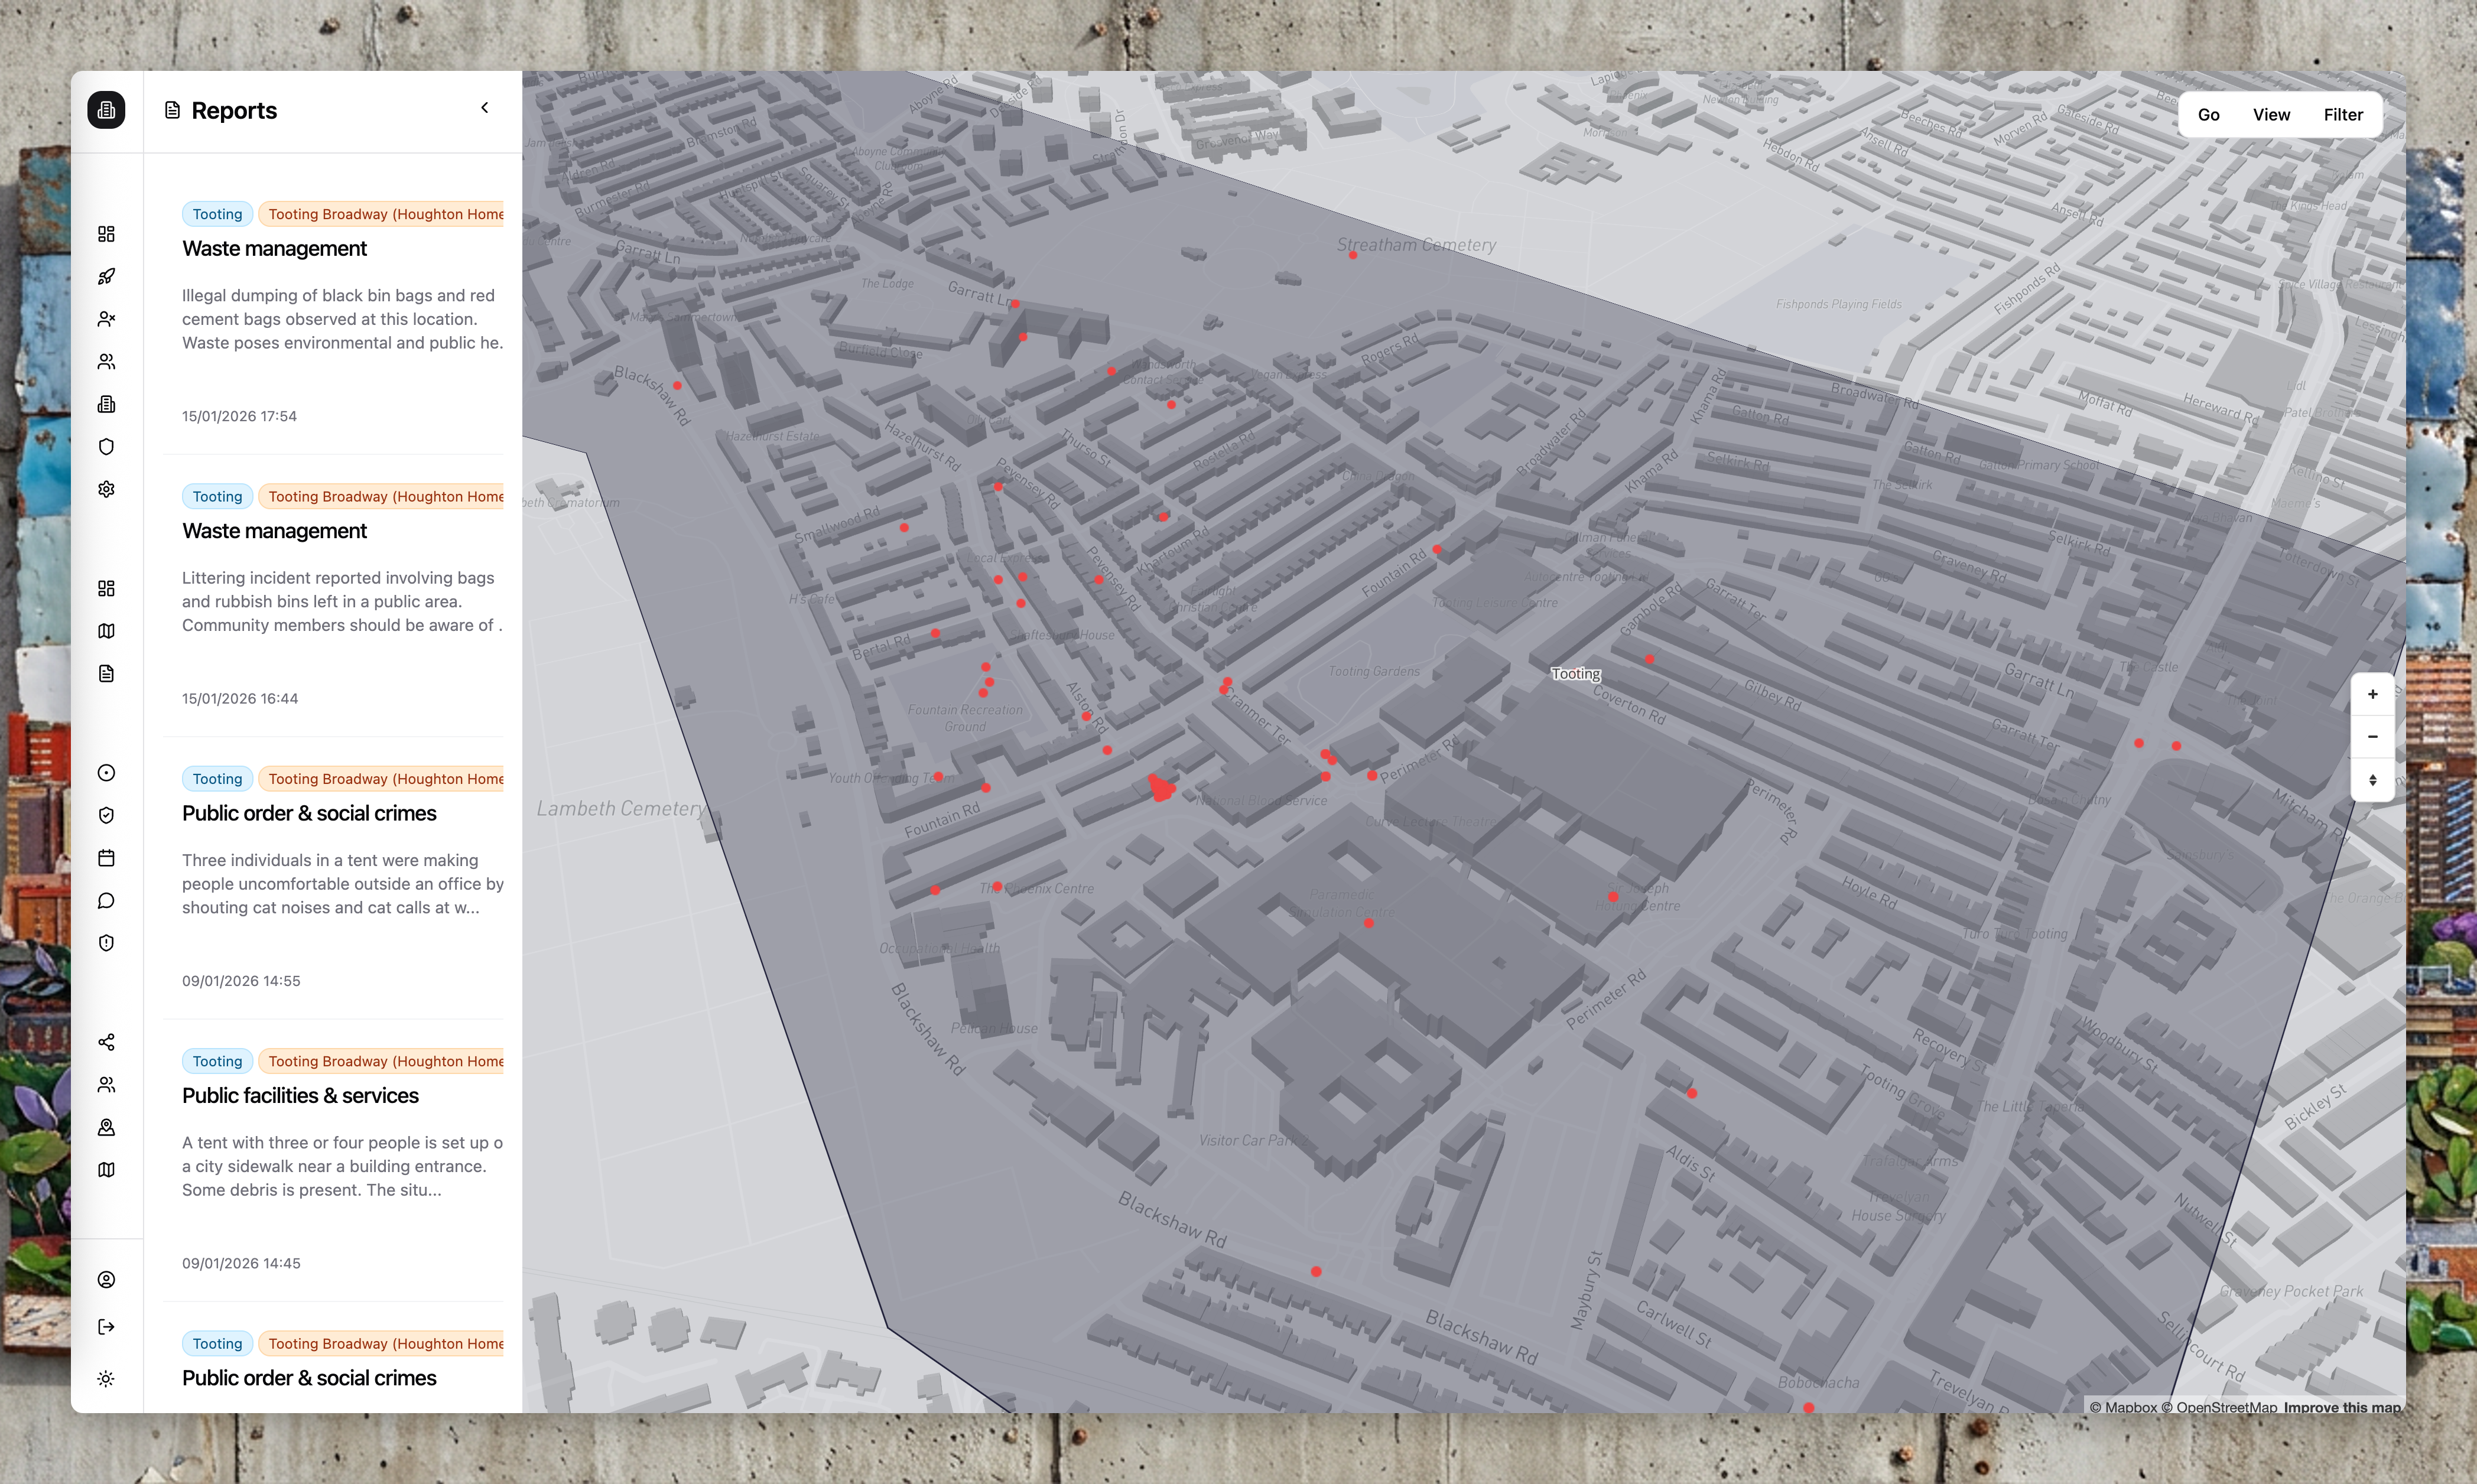
The Live Map shows "dots on a map"—every report submitted by community members or WhatsApp agents, positioned at its reported location. This is the intelligence layer of Community Wolf: a real-time view of what is happening in the areas you care about.
Map layers
- Report markers: Each marker represents a report submitted by the community or WhatsApp agents.
- Areas: Polygon overlays help you see coverage and filter activity by area.
- 3D buildings: In supported map views, buildings render in 3D for better context.
Filters and controls
Use the map controls to:
- Filter reports by type, severity, and date range
- Focus on a specific area or site
- Toggle report layers and labels
Report details (enterprise view)
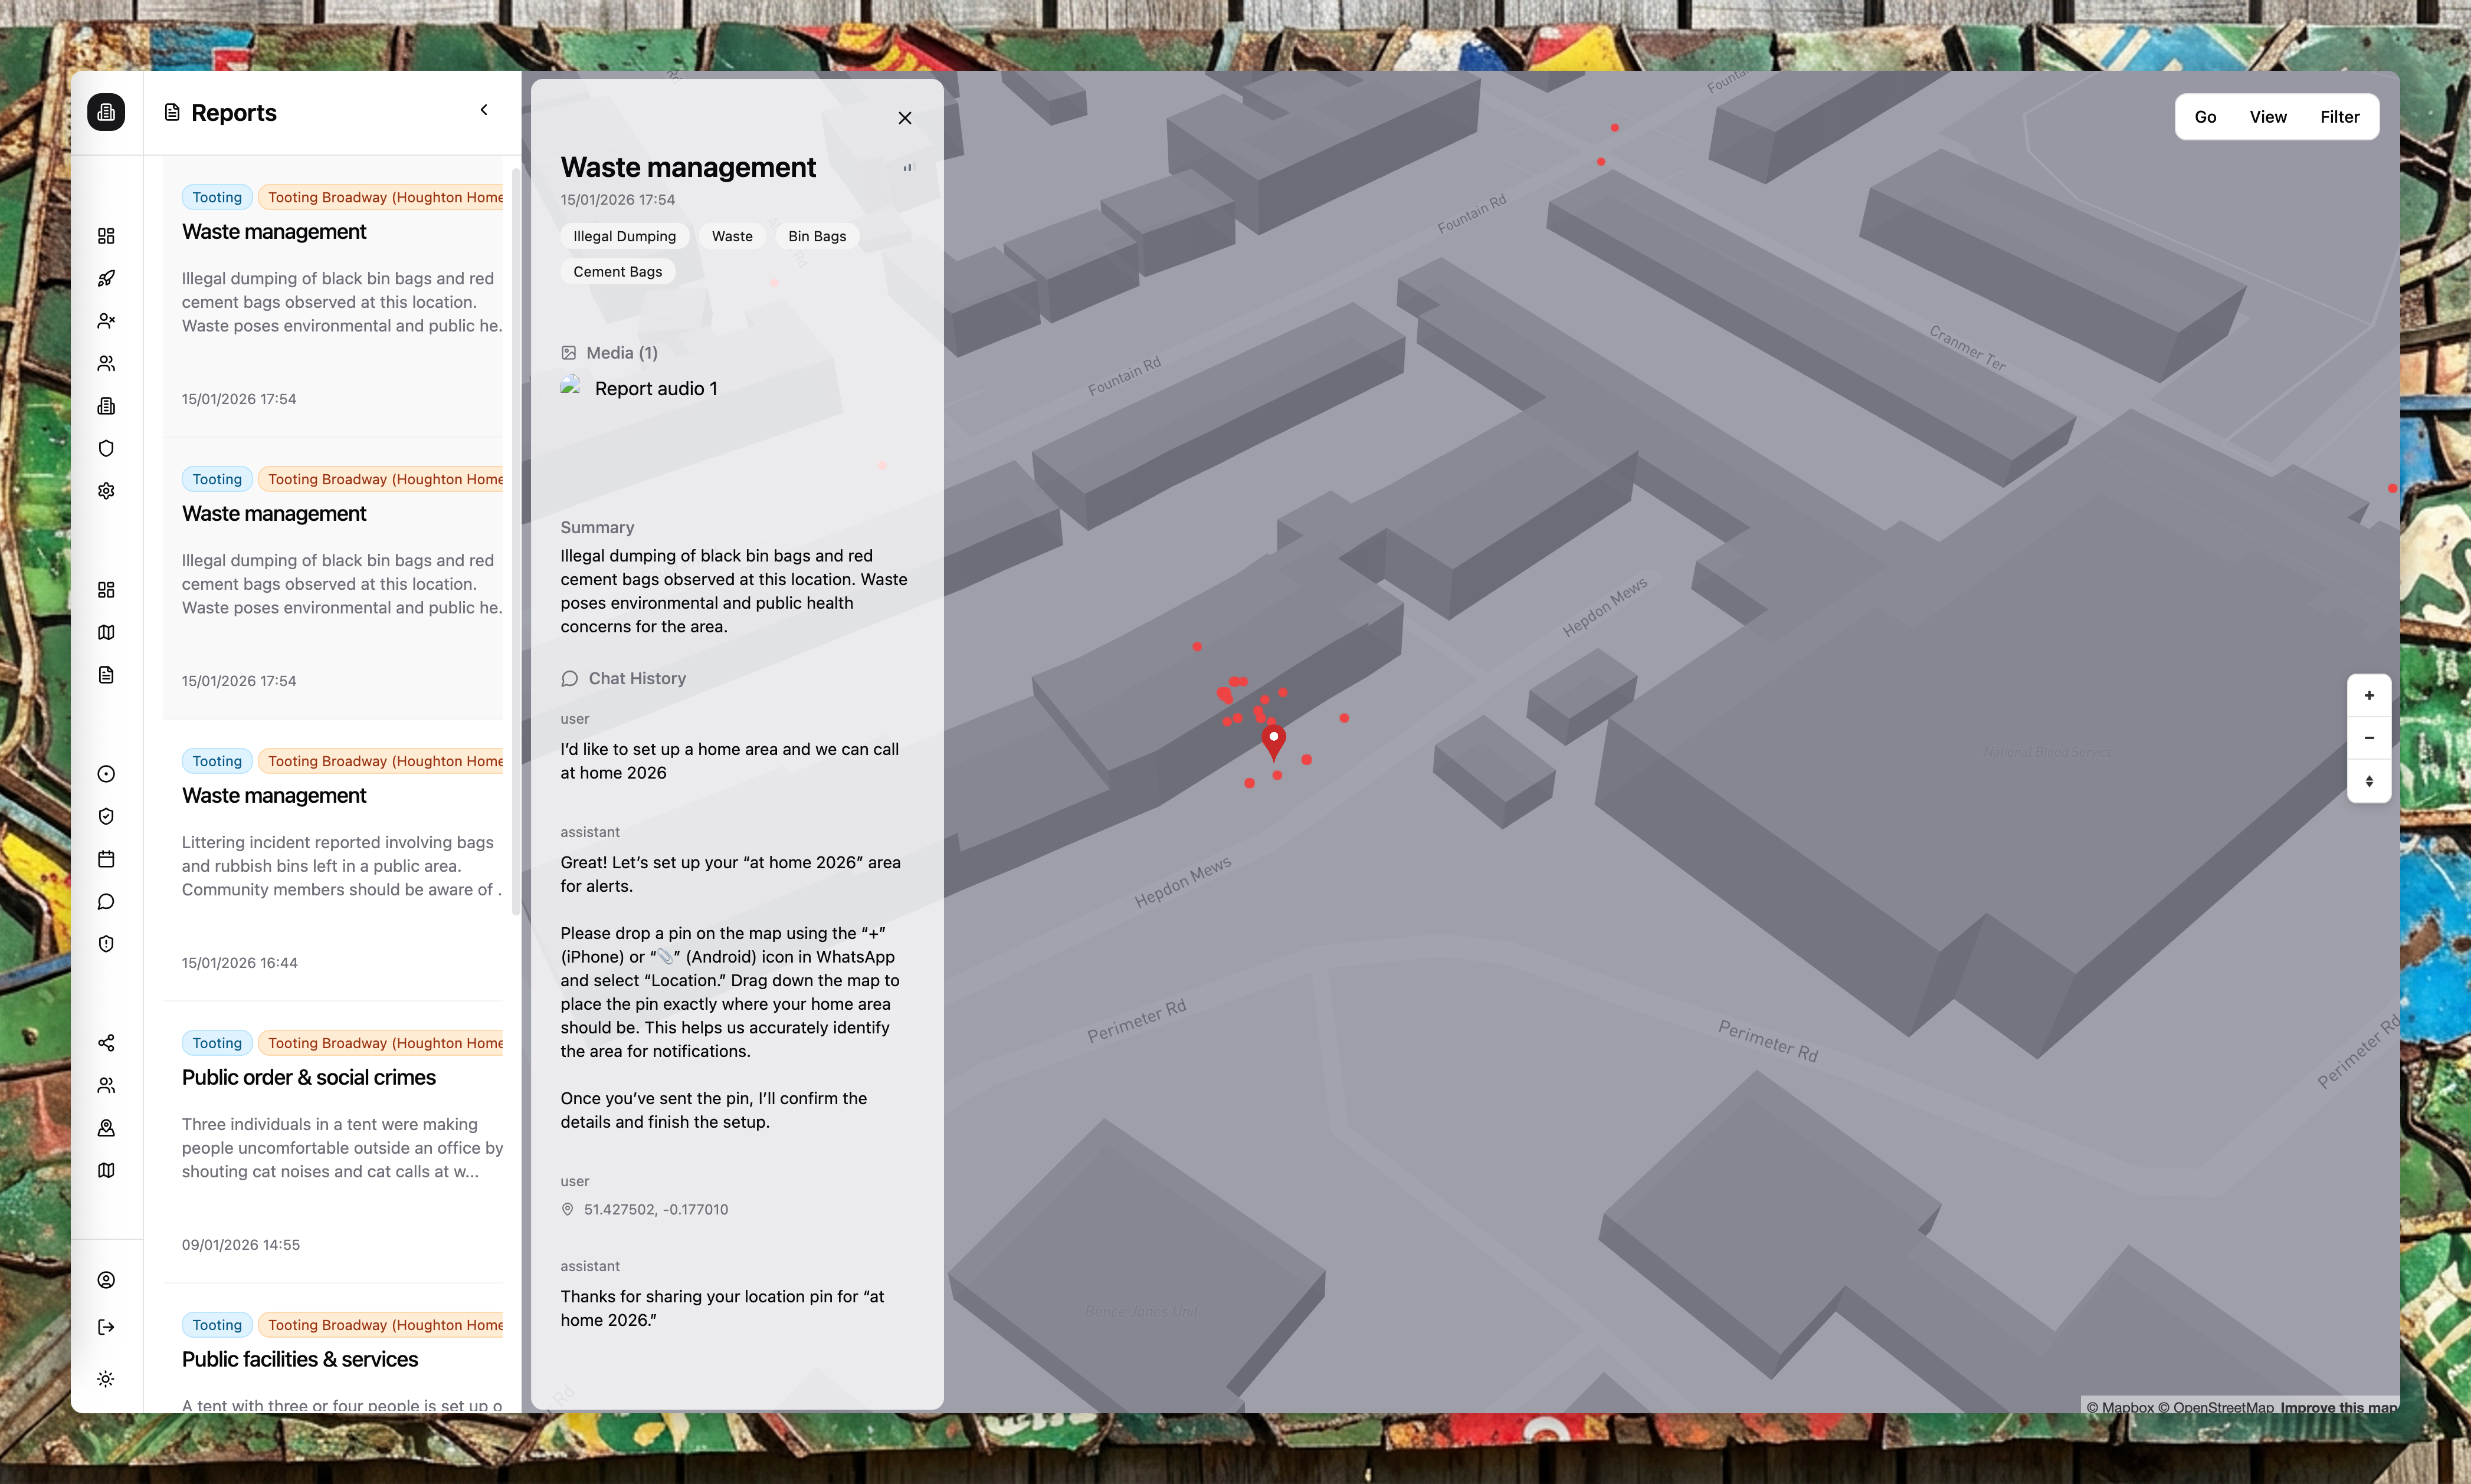
Click a report marker or select a report from the sidebar to see the full context:
- Report summary and description
- Media (photos, videos, voice notes) if provided
- Full conversation history with the reporting user
- Verification status and community responses
- Associated areas and sites
- Timestamps for every interaction
Enterprise users see richer detail than the public. The public view shows only a summarised version of each report.
Areas as catchments
The Live Map is scoped to your organisation's areas. Areas are geographic boundaries you define—they act as catchments that filter which reports you see.
If a report falls outside all your areas, it will not appear on your Live Map. This keeps your view focused on the locations you are responsible for.
Alerts and exports
Use Alert Flows for immediate notifications on new reports, and Export Flows for scheduled reporting.
The Live Map only displays reports that fall within your organisation's areas.